Traditional KPI reporting and performance metrics reporting can lead to unhealthy if not destructive organizational behaviors. A 30,000-foot-level reporting 2.0 methodology with its free app overcomes these problems.
Examples of Key Performance Indicator (KPI) and performance metrics reports are: profit, expense, work in process (WIP), lead time, units shipped, call center response quality, net promoter score, supplier performance, product sales, overtime per employee, call handling time, product quality, and the number of phone calls.
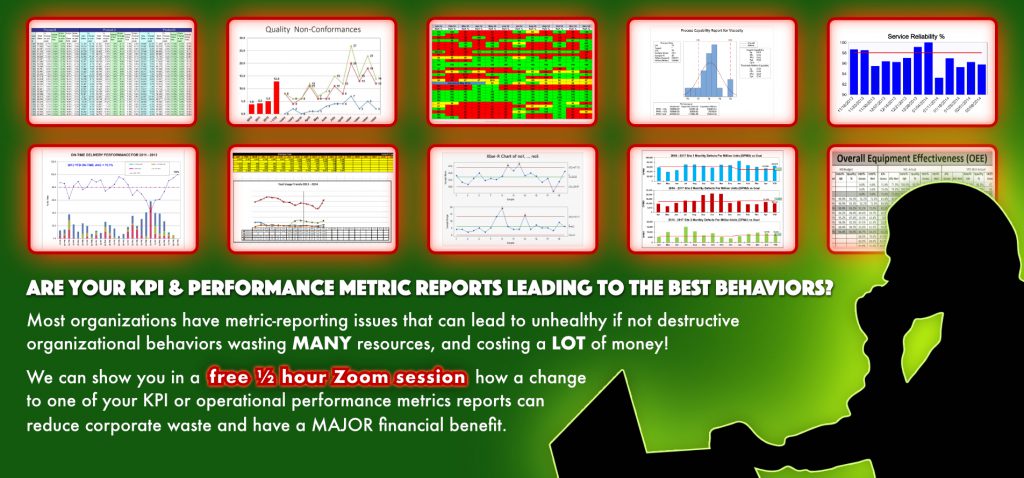
In addition to WHAT to include in KPI tracking dashboards and performance metrics reporting, organizations also need to address HOW to report the status of KPI tracking metrics from a process-output point of view; if they don’t, wasteful, if not destructive, behaviors can occur.
Organizations need to ask: Are our KPI reporting tools and performance metric reports leading to the BEST behaviors? More often than not, organizations have metric-reporting problems that waste MANY resources and cost a LOT of money unnecessarily!
Each of the above-listed KPI and performance metrics to report are an example of a Y response in the equation Y=f(X). This traditional performance metric reporting:
- Encourages “Y” management, often leading to playing games with the numbers to meet arbitrarily set next-reporting-period goals.
- Does not structurally include process “commonly-occurring output noise” in the reporting, which can impact the appropriate action or non-action for a reported measured response.
- Does not encourage process improvement, e.g., using a team to determine what X’s to change, so future Y responses improve.
KPI and Performance Metrics Reporting that leads to the BEST BEHAVIORS
A traditional reporting of one of the above KPIs and organizational performance metrics may have a monthly reporting for the whole organization or specific department. This reporting may be one entry in a table of numbers or as one metric in the Y-goal setting of a red-yellow-green scorecard.
However, the most appropriate action or non-action for a given situation does not typically occur with these reporting formats.
A 30,000-foot-level reporting methodology addresses these reporting problems through the following three steps:
- Determine if the Y process output response is stable from a high-level viewpoint.
- If a process response is considered stable, there is an automatic reporting of a best-estimated prediction statement in the report-out.
- If this futuristic statement is undesirable, there is a need to improve the X’s in a process.
KPI and Performance Metrics Reporting Example that leads to the BEST BEHAVIOR
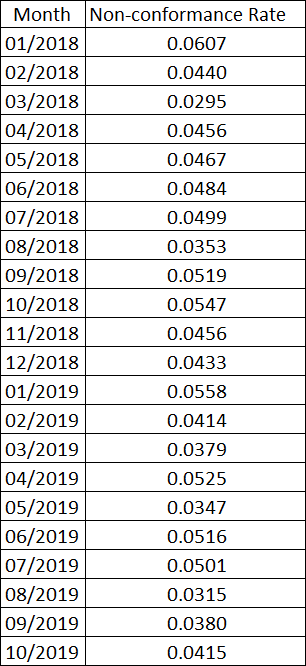
Consider the following over-time collected data. These data are “Monthly Non-conformance Rates”; however, all of the above KPI metrics (and process performance metrics) can have a similar reporting format.
Management 2.0 and Leadership System 2.0 books provide a free app for creating 30,000-foot-level reports. The result from the application of this app (www.smartersolutions.com/eprs-metrics-software) to this data is:
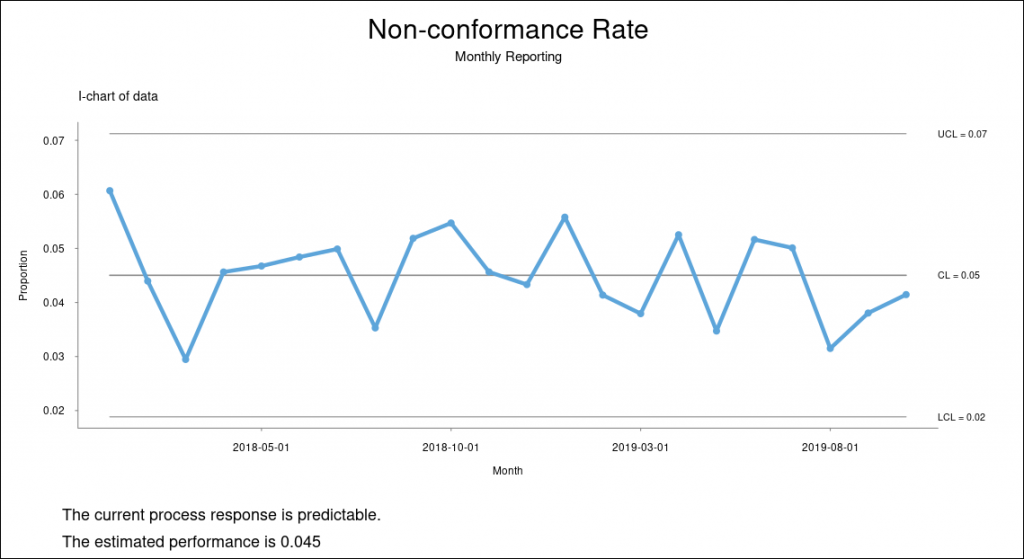
For this KPI and Performance Metrics Reporting:
- The Y process output response is considered stable since the individuals chart has no response values beyond the upper control limit (UCL) and lower control limit (LCL) statistically determined lines.
- The app automatically reports a best-estimate bottom-of-the-chart prediction statement (utilizing all data from the chart’s recent region of stability).
- If the reported prediction statement is undesirable (0.045 non-conformance rate in this example), there is a need for improving the X’s in a process.
- “Proof” of a process-output-response enhancement is when a 30,000-foot-level individuals’ chart staging indicates an enhanced performing response.
Free App to Create a 30,000-foot-level Report
The following video shows how to create a 30,000-foot-level chart for this attribute response data using a free app.
Next Steps
Schedule a video meeting with Forrest to see how your organization could benefit from the IEE system and 30,000-foot-level reporting using one of your datasets.
If you do not see a suitable time in the Schedule a Meeting link below, email Forrest at forrest.breyfogle@smartersolutions.com.