Organizations can benefit much when utilizing the concepts described in these managing for quality and performance excellence examples. Among other things metrics are evaluated from a high-level process output view point. This 30,000-foot-level reporting provides a predictive process-output statement, when appropriate, and can offer additional process insight that is not available using traditional scorecard or dashboard techniques.
The PDF article “Key Performance Indicators: Six KPI Dashboard Examples to Enhance your Business” by Forrest Breyfogle can be downloaded using the link at the bottom of this page. This article describes a performance management best practice for use of predictive Key Performance Indicator (KPI) dashboard reporting. The six examples in this article illustrate the benefit of this 30,000-foot-level performance management best practice approach for predictive KPI dashboard reporting.
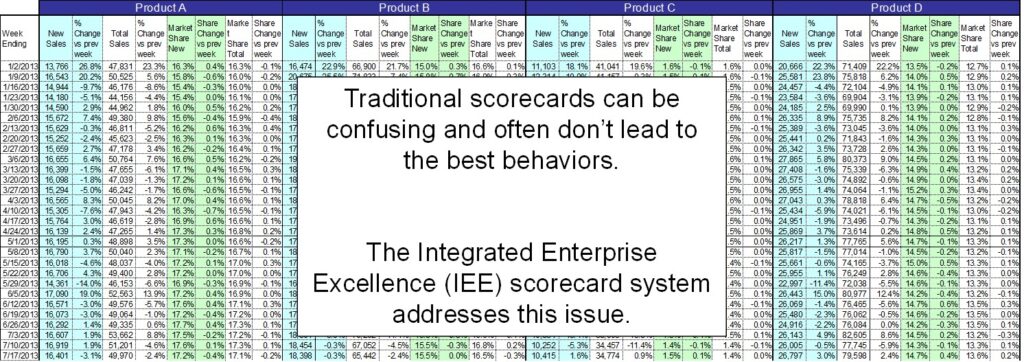
The document below elaborates on how to improve a scorecard reporting system. A 30,000-foot-level reporting system is described to improve this report-out.
General information about 30,000-foot-level reporting is:
- Peer-reviewed article: 30,000-foot-level Metric Reporting
- Video: 30,000-foot-level Performance Reporting Introduction (5 Minutes)
- Article: Positive Metric Performance Poor Business Performance: How Does this Happen?
Managing for Quality and Performance Excellence Examples and How-to-implement Illustrations
Application of 30,000-foot-level charting to an organizational enterprise scorecard, operational excellence and improvement system is described in:
- Eight application examples of how predictive 30,000-foot-level charts provide more information than traditional scorecards
- How to create an Operational Excellence system: Integrated Enterprise Excellence (IEE)
- Book: Integrated Enterprise Excellence (IEE) Volume II – Business Deployment: A Leaders′ Guide for Going Beyond Lean Six Sigma and the Balanced Scorecard
- Software that provides predictive scorecards which are integrated with the processes that created them: Enterprise Performance Reporting System (EPRS) software
A no-charge Minitab add-in is available for the easy creation of 30,000-foot-level charts
Download the PDF below (“Key Performance Indicators: Six KPI Dashboard Examples to Enhance your Business”) to gain KPI reporting insight from the managing for quality and performance excellence examples.