Process capability has long been used to quantify how well a process can meet customer requirements and specification limits.
For decades, engineers and quality professionals relied on traditional capability indices to assess whether variation was acceptable and whether corrective actions were needed.
However, in today’s digitally connected, enterprise-scale operating environments, classical interpretations of capability often fall short.
Executives need forward-looking insight, not just backward-looking statistics.
Process Capability Index 2.0 reframes capability thinking as part of a predictive business management system — connecting operational stability to financial outcomes, governance cadence, and strategic decision making.
Instead of treating capability as a localized shop-floor metric, organizations can elevate it into an enterprise intelligence asset that drives predictable performance.
What Is Process Capability?
The Cp process capabiity index evaluates how wide the specification limits are relative to the natural spread of a normally distributed process.
It compares the total tolerance width to six standard deviations of the data. Cp therefore reflects only variability and does not account for whether the process average is centered between the limits.
Mathematically this relationship is:

where LSL and USL are the lower specification limit and upper specification limit, respectively, and distribution spread is described as six times standard deviation; i.e., 6σ.
Cpk expands on Cp by incorporating both dispersion and centering. It measures how close the process mean is to the nearest specification boundary while still considering overall variation.
When a process drifts toward one side of the tolerance range, Cpk decreases even if variability remains unchanged.
Mathematically, the process capability index Cpk can be represented as the minimum value of the two quantities

Pp and Ppk are commonly referred to as long-term or overall performance indices. They use overall data variation rather than within-subgroup variation.
Pp parallels Cp by focusing on spread only, while Ppk parallels Cpk by accounting for both spread and centering.
When data follow a normal distribution, the index Pp represents the allowable tolerance spread relative to the actual spread of the data n. Mathematically this relationship is:

where LSL and USL are the lower specification limit and upper specification limit. There is no quantification for data centering described within this mathematical relationship.
Mathematically, Ppk can be represented as the minimum value of the two quantities

Although these indices appear mathematically straightforward, the assumptions behind their calculations are often overlooked.
Their accuracy depends on stable processes, appropriate sampling, and reasonably normal distributions. Violations of these assumptions can distort conclusions.
Standard deviation is the foundation of all capability index calculations.
However, there are multiple ways to estimate standard deviation depending on how data are collected and grouped.
Different methods can produce meaningfully different numerical results.
In some cases, it is impossible to get a specific desired result if data are not collected in the appropriate fashion.
Consider three common data collection approaches:
- Situation 1. Subgrouped measurements plotted on an X-bar and R chart (e.g., subgroups, sample size of 5).
- Situation 2. Individual measurements plotted on an individuals chart.
- Situation 3. Random samples taken directly from a population.
For these three situations, Cp, Cpk, Pp and Ppk, a standard deviation estimate ( ) is determined through the relationships shown in the following Table 1:

Table 1: Calculating Standard Deviation
*Some statistical software packages further modify these estimates by pooling subgroup statistics to remove bias. While technically valid, these variations can lead to inconsistent capability values for the same underlying process.
Cp, Cpk, Pp and Ppk relationships
Process capability describes the inherent ability of a process to consistently produce outputs within defined specification limits when operating in a stable condition. In simple terms, it answers the question:
Is this process capable of meeting requirements reliably?
Capability analysis evaluates:
- The natural variability of a process
- The width of the specification limits
- How centered the process is relative to the target
A capable process exhibits predictable performance, minimal defects, and stable output over time.
Traditional manufacturing environments used capability primarily for product conformity.
Today, service operations, digital workflows, healthcare, logistics, finance, and knowledge work increasingly rely on capability thinking to manage performance risk.
However, capability by itself does not guarantee business success.
A process can be statistically capable yet financially misaligned, strategically misdirected, or operationally brittle when demand patterns change.
That is where modern capability must integrate with enterprise analytics and predictive performance metrics.
The sample dataset below is presented to demonstrate how varying data collection methods can significantly influence reported process capability results.

Table 2: Process Time-series Data
Accurate capability analysis requires that the underlying data come from a statistically stable process operating under control conditions.
Process capability metrics are only meaningful when they are derived from data generated by a statistically stable operation.
To evaluate this process, an analyst might choose to collect a single observation per subgroup rather than five. These alternative sampling approaches produce different standard deviation estimates, as shown below.

 (Consider that sample one in the above table was the individual reading for each subgroup)

Using specification limits of 95 to 105, the analysis software applied comparable standard deviation estimates when calculating the resulting capability metrics, as illustrated in Figures 1 and 2.

Figure 1: Process Capability for Five-sample subgroup

Figure 2: Process Capability for One-sample subgroup
Table 3 summaries the process capability results shown in Figure 1 and 2.

Table 3: Summary of Cp, Cpk, Pp and Ppk Values from the Analyses
The results indicate a substantial gap in Cp and Cpk values when comparing single-observation subgroups to five-observation subgroups.
This difference can be explained by how variability is estimated in each case. When an X-bar and R chart is used, the standard deviation is derived from within-subgroup variation, whereas an individuals chart estimates variability based on changes between successive subgroups.
In a well-designed Measurement System Analysis framework, conclusions about process performance should remain consistent regardless of how samples are collected.
The discrepancies observed here indicate that capability reporting is vulnerable to measurement system limitations, since using one observation versus five produced materially different results rather than minor random variation.
In this example, thePp and Ppk values appear relatively consistent across both sampling approaches.
However, prior analysis using X-bar and R control charts showed the process to be statistically unstable, which makes any capability evaluation inappropriate under those conditions.
That same analysis also explains why individuals charts offer technical advantages over traditional subgroup-based charts.
Process Capability Analysis 2.0
Additional measurement system concerns also arise when relying on process capability indices, including:
- When the underlying data do not follow a normal distribution, these formulas no longer produce valid results.
- The real-world meaning of reported capability values may be unclear or potentially misleading.
- Capability metrics lack credibility unless they are supported by evidence of statistical stability from control chart analysis. Evaluating capability on an unstable process can lead to misleading or invalid conclusions.
- Capability indices describe past behavior but do not generate a forward-looking performance prediction.
The following introduces a predictive performance reporting approach designed to resolve these limitations by answering the questions:
- Is the process unstable or did something out of the ordinary occur, which requires action or no action?
- Is the process stable and meeting internal and external customer needs? If so, no action is required.
- Is the process stable but does not meet internal and external customer needs? If so, process improvement efforts are needed.
Reporting process performance through capability indices, charts, scorecards, or simple numeric tables often leads to inconsistent interpretations, creating a measurement system concern and failing to directly support the three required decision outcomes.
The example below demonstrates a method for evaluating process output from an enterprise-level perspective, often described as a 30,000-foot view (not unlike the view of the terrain below from the window of an airplane in flight). In this approach, individuals chart subgrouping is structured so that normal input-driven variation appears across subgroups rather than within them.
Stable operating periods provide reliable data for estimating a process’s defect or nonconformance rate during those intervals. When a recent stable period exists, those observations can serve as a representative sample of expected future behavior, allowing a forward-looking performance estimate — assuming no significant changes occur in process inputs or execution methods.
When a process remains statistically stable but delivers an unacceptable level of defects, organizations can launch targeted improvement initiatives — such as Lean Six Sigma projects — to modify process inputs, methods, or controls in order to elevate overall performance.
For continuous measurements, probability plots can be used to estimate expected defect levels expressed as percentages or defects per million opportunities (DPMO). For attribute-based data, the projected defect rate is calculated by aggregating failure proportions across stable operating periods.
Figure 3 presents the 30,000-foot-level visualization of the dataset summarized in Table 1.
Notably, the projected nonconformance rate of 26.852% shown in Figure 3 closely aligns with the total defect rate of 268,525.98 PPM reported in Figure 1.

Figure 3: 30,000-foot-level Chart of Data from Table 13
This form of Process capability analysis reporting evaluates whether a process is statistically stable and capable of meeting defined performance requirements.
This report includes (in one graphic):
- Data collection and validation
- Stability assessment (control charts)
- Distribution evaluation
- Capability index calculation (as non-conformance rate statement, which is easier to understand than Cp, Cpk, Pp, and Ppk)
- Interpretation and action planning
A critical prerequisite is process stability. If a process is affected by special causes or structural instability, capability indices become misleading. Control chart analysis must confirm predictable behavior before capability metrics are trusted.
A 30,000-foot-level report can be created for your data using our free-30,000-foot-level app. Forrest ([email protected]) can assist with this predictive-performance report creation.
Beyond statistical mechanics, modern capability analysis should also evaluate:
- Business relevance of specification limits
- Economic consequences of variation
- Customer experience implications
- Risk exposure under demand variability
This expands capability from a quality metric into a business intelligence instrument.
However, with Process Capability 2.0, instead of reporting process capability with Cp/Cpk/Pp/Ppk indices, a probability plot would be used with continuous data to reporting percentage non-conformance when a specification exists, which is much easier to explain and understand than Cp/Cpk/Pp/Ppk process capability indices.
Ppk evaluates long-term performance using overall data variation, including shifts and drifts.
Interpretation guidelines often reference:
- Cpk ≥ 1.33 → generally capable
- Cpk ≥ 1.67 → highly capable
- Cpk ≥ 2.00 → world-class (in controlled environments)
However, these numeric thresholds frequently oversimplify reality. A high Cpk does not necessarily mean:
- The process supports strategic objectives
- Financial risk is controlled
- Customer expectations are met dynamically
- Upstream and downstream interactions are optimized
Executives often misinterpret Cpk and Ppk as performance guarantees when they merely quantify historical variability under constrained assumptions.
Modern organizations must contextualize Cpk and Ppk within broader operational systems and predictive performance metrics.
Predictive Performance Metrics
Traditional capability indices are backward-looking. They describe what happened, not what will happen.
Predictive performance metrics extend capability thinking by:
- Modeling future outcomes probabilistically
- Linking operational variation to financial risk
- Forecasting stability trajectories
- Identifying leading indicators of degradation
- Supporting proactive governance decisions
Instead of reacting to defects or late indicators, organizations use predictive analytics to anticipate capability erosion before it impacts customers or earnings.
This aligns directly with Integrated Enterprise Excellence (IEE) principles:
- Enterprise-level metrics
- Financial linkage
- Governance cadence
- System optimization rather than silo optimization
Process capability becomes one input into a broader predictive ecosystem rather than a standalone quality statistic.
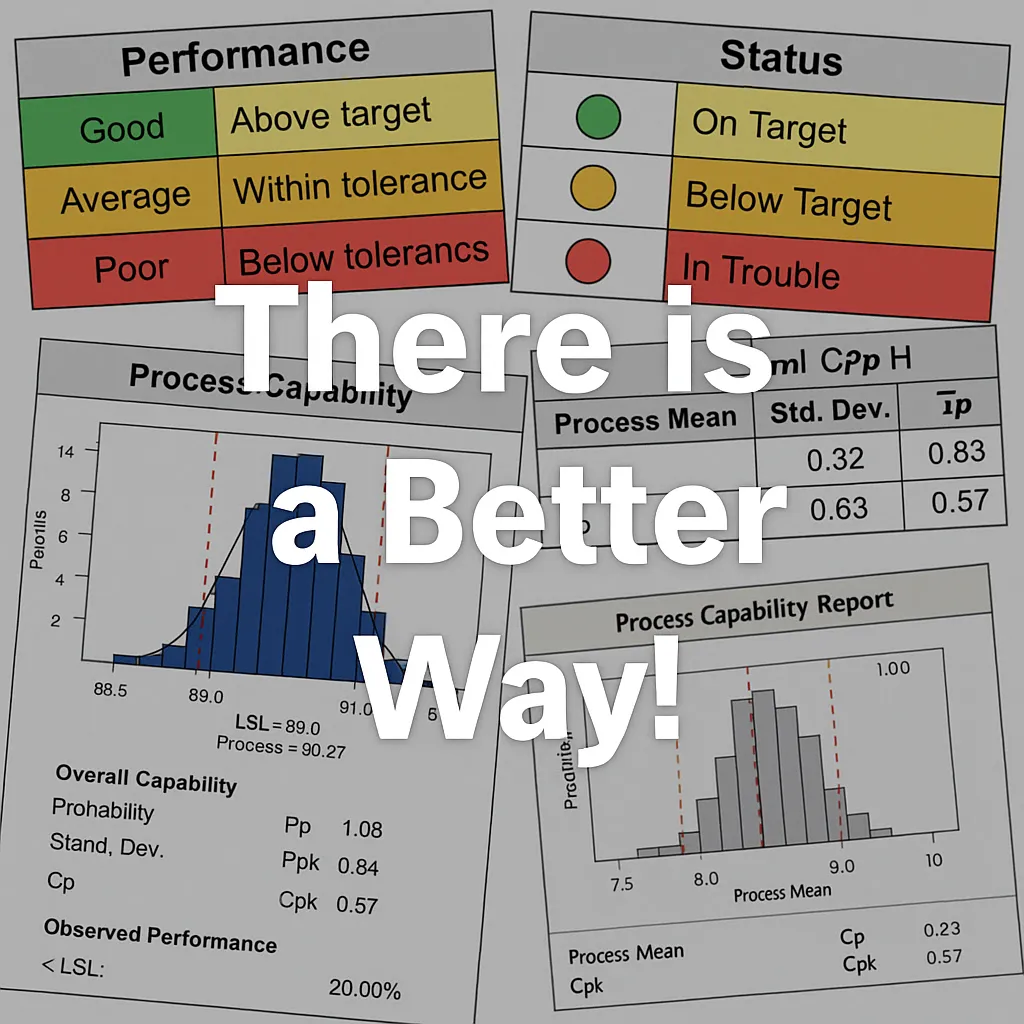
The following figure shows the transition of a red-yellow-green actual report to a 30,000-foot-level report.

The red-yellow-green scorecard shown above, taken from a real organizational dashboard, visually suggests that performance improved as several indicators shifted from red (poor performance) to green (acceptable performance) over successive reporting cycles. At face value, this pattern implies that the corrective actions taken were successful and that the process is now under control.
However, when the identical dataset is examined using a 30,000-foot-level view (bottom image) within a Digital Transformation 2.0 environment, a very different conclusion emerges. The system-level analysis shows that overall behavior has not materially changed and that a non-conformance rate of 32.6% persists across the same period represented by the color changes.
From a predictive standpoint, this result indicates that roughly one-third of future observations are likely to fall into a red condition unless structural improvements are made to the process itself. This forward-looking perspective delivers far more actionable intelligence than repeatedly reacting to short-term red signals, which are often driven by normal process noise rather than true performance shifts.
If you would like to see how your own KPI data can be converted into a 30,000-foot-level format and uncover insights that are not visible in standard red-yellow-green dashboards or tabular reports, schedule a short video conversation with Forrest.
Schedule a 30-Minute Transformation Strategy Session:
https://smartersolutions.com/schedule-zoom-session/
If email is preferred, Forrest can be reached directly at:
[email protected]
Why Traditional Capability Thinking Breaks Down at Scale
Many organizations experience frustration when scaling traditional SPC and capability approaches:
- Local improvements fail to translate into enterprise results
- Teams optimize isolated processes while system performance stagnates
- Metrics become fragmented across silos
- Executives lack confidence in operational data
- Governance becomes reactive instead of predictive
Root causes include:
- Misaligned metrics architecture
- Overreliance on lagging indicators
- Fragmented ownership
- Inconsistent data definitions
- Tool-centric rather than system-centric thinking
Process Capability Index 2.0 reframes capability as part of an integrated business management system rather than a statistical exercise.
Integrating Process Capability into Executive Decision Systems
When properly architected, capability metrics support:
- Strategic planning
- Capital allocation
- Risk management
- Continuous improvement prioritization
- Digital transformation initiatives
- AI deployment governance
Executives gain visibility into:
- Which processes threaten financial predictability
- Where investment produces the highest ROI
- How operational risk evolves over time
- Which improvements stabilize earnings
Capability becomes actionable intelligence instead of technical noise that is a part of the Integrated Enterprise Excellence (IEE) System, which can orchestrates the business.

Implementation Roadmap for Process Capability Index 2.0
- Stabilize core processes using SPC discipline
- Standardize data definitions enterprise-wide
- Validate measurement systems
- Automate capability calculations with statistical controls
- Link capability to financial impact models
- Integrate into governance cadence
- Deploy predictive analytics and forecasting
- Continuously refine system architecture
This roadmap aligns with mature operational excellence and digital transformation strategies.
Common Pitfalls to Avoid
- Treating Cpk as a performance guarantee
- Ignoring stability prerequisites
- Over-automating without validation
- Fragmented dashboards
- Misaligned incentives
- Local optimization
- Tool-driven implementations
References
You may reference these externally within the article:
- ASQ – Process Capability Indices Overview
American Society for Quality - NIST – Engineering Statistics Handbook: Process Capability
National Institute of Standards and Technology - Montgomery, D.C. – Introduction to Statistical Quality Control
- ISO 22514 – Process Capability and Performance Standards
- Minitab – Capability Analysis Methods
Next Steps
Position your differentiation clearly:
Organizations that rely solely on traditional capability indices often struggle to achieve predictable enterprise performance. Learn how Integrated Enterprise Excellence transforms process capability into a predictive business management system that aligns operational stability with financial outcomes.
Let’s do one or more of the following:
- Schedule a Strategy Session
- Explore Predictive Performance Metrics
- Download Enterprise Performance Resources
Schedule a 30-Minute Transformation Strategy Session:
https://smartersolutions.com/schedule-zoom-session/
If email is preferred, Forrest can be reached directly at:
[email protected]