An enhanced business performance management system is needed that leads to the most appropriate behaviors throughout an organization. If this is not done, much organizational efforts can be wasted and unintended consequences can result. This enhanced-business-performance-management objective can be achieved through the Integrated Enterprise Excellence (IEE) business management system.
Need for an Enhanced Business Performance Management System
How can organizations benefit from an improved business performance management system?
- In the government: Avoid giving primary focus to the creation of additional controls that are expensive and often not effective in resolving problems. Instead, integrate measurements, strategies, and improvement efforts so that organizational silos are broken down and the use of tax-payer dollars are maximized.
- In businesses: A system that provides direction for achievement of the three Rs of business; i.e., everyone doing the Right things, and doing them Right, at the Right time.
A business performance management system should address these three R needs. This governance system solution should be a no-nonsense, long-lasting business governance system with a framework that integrates scorecards, strategic planning, business improvement, and controls.
This business performance management system should be able to address the complexities of business and effectively navigate around the hazards. This is not unlike achieving a good golf score by effectively navigating the course obstacles, as illustrated Figure 1.

Figure 1: Business Performance Management System Navigation
Rules for Enhanced Business Performance Management System
Rules for achievement of an effective business performance management system are shown in Figure 2. However, often these rules do not have an effective execution orchestration. To illustrate this point, consider how typical metrics often are reported:
- Fiscal year
- Unrelated to improvement system
- Point to point comparisons

Figure 2: Rules for an Effective Business Performance Management System
What is needed is a system that brings all the rules together, as illustrated in Figure 3.
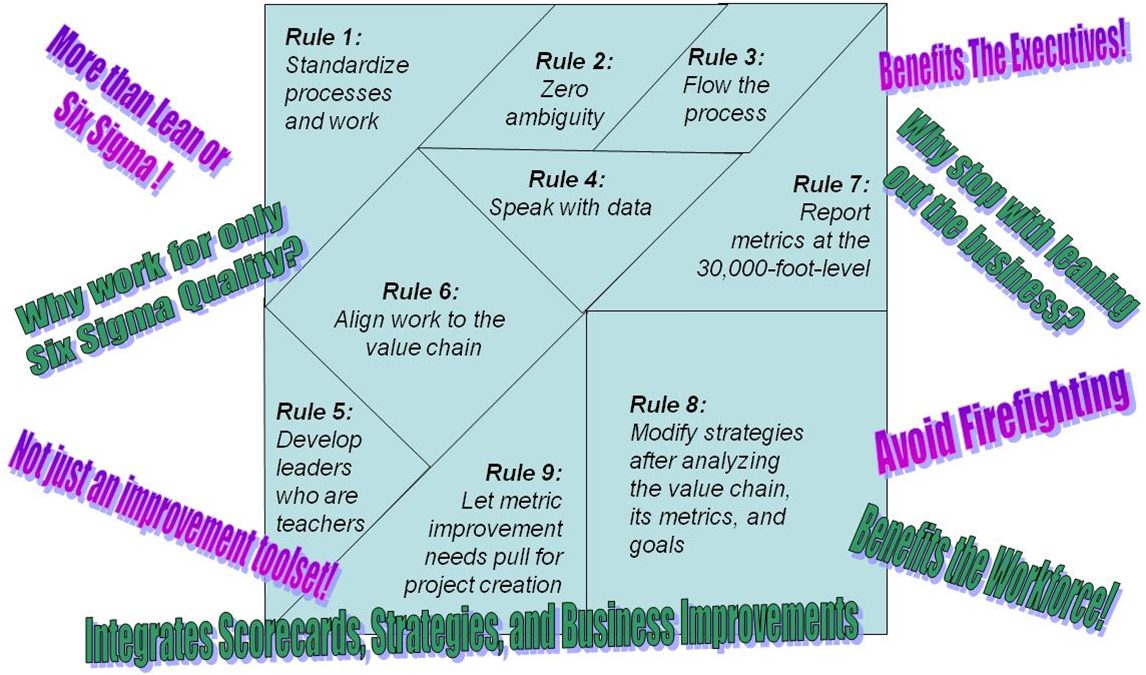
Figure 3: Orchestration of Rules in a Business Performance Management System
Objective for a Enhanced Business Performance Management System
The output of a process is the result of the process steps and their inputs, as illustrated in Figure 4.

Figure 4: Processes and Outputs in a Business Performance Management System
Organizations benefit when they have effective metrics that:
- View the enterprise as a system of processes
- View metrics as the result of these processes
- Acknowledge the effect of variability within these processes
- Support long-lasting change as the result of systematic improvement to these processes. However, often these metric needs are not addressed in an organization
Current State of Many Business Performance Management Systems
Past CFOs Jean E. Cunningham and Orest J. Fiume in their book Real Numbers, Managing Times Press, 2003 state:
- … information must also be easily understood and actionable. Over the years, however, managers have been forced to understand their own departments, not in terms of income and cost, but as variances and percentages that bear little relationship to reality.
- Those same managers learned that variances could be nudged up or down to present a better picture of the operation – for instance by using labor hours to make a million pieces of plastic that were not actually needed – even if that meant damaging the real business interests.
- Complex accounting created a kind of funhouse mirror, where a skinny man could look fat simply by shifting his position.

Today typical metrics do not:
- View the enterprise as a system of processes
- See metrics as the result of these processes
- Acknowledge the effect of variability within these processes
- Support long-lasting change as the result of systematic improvement to these processes
What is needed: a business performance management system that addresses these four bullet points and the issues that were highlighted in Real Numbers.
Enhanced Business Performance Management System
Integrated Enterprise Excellence (IEE) provides a system to address the previously described needs. IEE offers:
- Sustainable Business Management Governance System
- Framework for Health Policy Creation/Deployment
- Predictive Metrics
- Integration of Business Scorecards, Strategies, and Process Improvement, and Control Systems, IEE goes beyond Lean Six Sigma’s project-based defect- and waste-reduction method.
IEE nine-step execution system, as shown in Figure 5, is applicable to:
- Large and small organizations
- For-profit and non-profit business and government

Figure 5: An Enhanced Business Performance Management System
With the IEE system, an organization can start a small deployment (e.g., in one part of its organization) and expand its application of the techniques in the business over time.
More information about IEE is addressed in the article: “Positive Metric Performance, Poor Business Performance: How Does this Happen?”
Contact Us to set up a time to discuss with Forrest Breyfogle how your organization might gain much from an Integrated Enterprise Excellence (IEE) enhanced business performance management system.