An enhanced business management system to improve bottom line is provided through the Integrated Enterprise Excellence (IEE) Business Management System.
Need for an Enhanced Business Management System to Improve the Bottom Line
The importance of incorporating an enhanced business management system implementation in organizations is highlighted by the Business Week article “The Trouble with IBM”. The following points were made in this article and can be used to support the position for an enhanced business management system need in companies:
- CIA awarded a 600 million-dollar contract to Amazon.com over IBM for its cloud computing. IBM challenged the selection. The corporate cliché of the 1970s and ’80s, that no one ever got fired for buying IBM, had never seemed less true. IBM withdrew its challenge.
What has happened at IBM? Many organizations could list similar occurrences. The ″Trouble with IBM″ article states:
- In 2011, when Palmisano named Rometty the company’s first female CEO, IBM was celebrating its centennial with record sales, profits, and share price. At this time ″Watson″, an artificial-intelligence project, hit public acclaim by beating humanchampions on Jeopardy!
- Since Rometty took over the leadership of IBM, revenue has declined for eight consecutive quarters. This occurrence is in a time frame when most American corporations have flourished. It turns out that Rometty inherited a far more dire position than she, or much of Wall Street, may have realized.
- Much of what is wrong is the result from something IBM is doing ″right″; i.e., steadily increasing a measurement that Wall Street adores, its adjusted earnings per share.
- To make earnings rise while revenue is falling, Rometty has cut costs, sold business lines, fired workers, figured out ways to lower IBM’s tax rate, bought back shares, and taken on debt.
- In an August 2013 study of 15 cloud infrastructure providers, research firm Gartner rated IBM worst, behind Microsoft, Rackspace, and Verizon.
To capture and make sense of big data, corporate customers are asking for new kinds of software, another change to which IBM is racing to adjust. - The software unit’s revenue growth is slowing, from 8.7 percent in 2011 to 2.9 percent last year. Rometty has made more than a dozen acquisitions to boost IBM’s offerings,
- Wall Street analysts have been warning that IBM can’t keep cutting its way to profits forever. In May 2013, by Bloomberg’s count, half the analysts covering the stock rated it a buy. Today the rate is less than one in four.
What could done to avoid the above issues so that the organization would continue to flourish.
Business Management System to Improve the Bottom: Implementation and Importance
Leadership at IBM and other companies often strive to meet Wall Street’s short-term expectations by given their primary focus to cutting costs and making other manipulations; e.g., business lines sales, workers being fired, lower tax manipulations, shares bought back, and debt accumulation. Often it appears that corporate executives forget to build on their organization’s strengths, forgo the future, and does whatever it takes to make next quarter’s Wall Street’s numbers look favorable.
To accomplish this objective, it seems like businesses strive to obtain a superman or superwoman to be the CEO of their company. However, doesn’t this approach to make a business successful seem risky? What if the person at the top of the organization has errors in their thinking or sacrifices the long-term for the short-term without any risk assessment? My response to these questions is yes there is risk with this approach, but what is an alternative methodology?
Organizations will avoid the type of problems that IBM experienced if they use a more data driven decision-making approach, which considers risk. This approach should formulate strategic decisions in a team environment that does not depend upon the gut instincts of the CEO. Not every company has a leader who had incredible insight to what the customer really wanted like Steve Jobs did when he turned Apple around upon his return to lead the company in the late 1990’s.
What organizations need is an enhanced business management system implementation that incorporates the use of data and structurally makes risk assessments, where one cannot play games with the numbers to make things look better than they really are. Organizations need a system that works effectively in a team environment, which blends predictive performance measures with analytically/innovatively determined strategies that lead to improvement efforts that benefit the enterprise as a whole.
Integrated Enterprise Excellence (IEE) is an approach that addresses need.
Integrated Enterprise Excellence (IEE) Business Management System to Improve the Bottom Line
Organizations benefit when they use the 9-step IEE business management system for their enhanced business management system implementation:
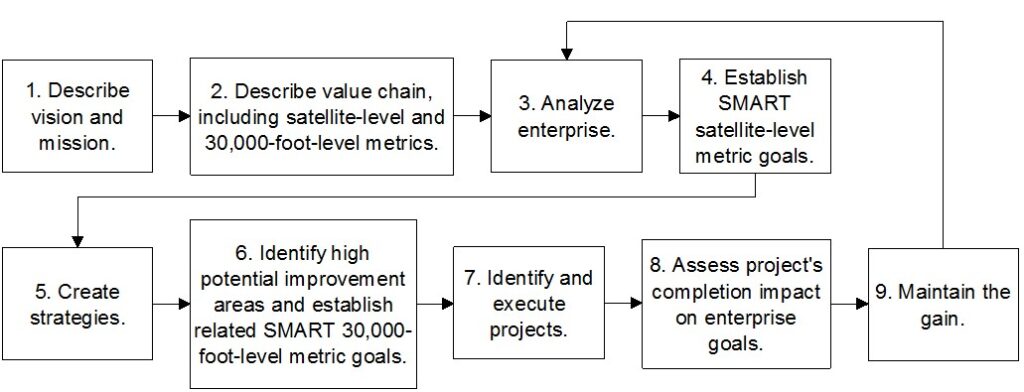
The execution of this enhanced business management system implementation roadmap is described in the book, Integrated Enterprise Excellence, Volume II. The following will net out deliverable items for in each of these steps.
Step 1: Describe Vision and Mission
In Step 1, of the above 9-step roadmap, vision and mission statements are to be inspired words chosen by leadership that convey the purpose and direction of an organization. These statements present a common futuristic vision from which the other steps of this roadmap are to be aligned.
Step 2: IEE Value Chain
In Step 2 of this enhanced business management system implementation roadmap, the IEE value chain describes what the organization does and how it measures its performance. The IEE value chain provides predictive measurements for functional performance from a process point of view. This 30,000-foot-level approach for performance tracking has much benefit over traditional approaches. This point was illustrated where ten traditional dashboards/scorecards where transitioned from historical measurement to a predictive statement. The IEE value chain can be made clickable, where metrics are automatically updated. When the IEE value chain information is readily available, organizations can use this information at the process-owner level or the executive level for making strategic decisions. The strategic application of the IEE value chain will next be discussed as part of this enhanced business management system implementation.
Step 3: IEE Analyze Phase
Step 3 of the 9-step IEE system provides an analysis of the enterprise as a whole to determine what might be done to improve the business. Integrated Enterprise Excellence Volume II has a check-list of tasks that should be addressed in this enhanced business management system implementation phase. This checklist includes the following:
- The organizational value-chain metrics can be examined along with related hypothesis tests; e.g., is there a statistical difference in the response from the four departments that perform the task? Significant findings can provide insight to what should be done differently in the process.
- Address voice of the customer (VOC) inputs to determine improvement opportunities for current product offerings and potential future ventures.
- Examine the enterprise as a whole to determine where there is a bottleneck or constraint in the organization that should be address. For example, if there is excess manufacturing capacity, perhaps the sales process or development process is the constraint that should be given strategic metric-improvement need focus.
- Examine the economy to determine if any current directions should be readjusted.
- Evaluate risks that should be addressed; e.g., perhaps focus should address the current state where too much revenue is dependent on one customer, the company is too reliant on one supplier, or currently have a high-risk IT infrastructure issue.
- Assess policies and see if they are leading to the most appropriate behaviors.
Step 4: IEE Financial Goal Setting
Determine financial goals that are tracked over time using a 30,000-foot-level reporting format. In the IEE system, financial-metric tracking is referred to a satellite-level reporting.
With this form of reporting, specific targets are not created for quarterly reports or any other calendar-year characteristic but from measuring processes and their improvements from a big picture point of view. Financial goals need to be reasonable for the organization’s industry and economic; e.g., improve the mean monthly profit margins by 1% in 8 months.
Step 5: IEE Strategic Planning
Often organizational goals are established and worded from an alignment with the organization’s vision and mission. This can result in statements like we want to be the best of the best. This form of statement is difficult to get your arms around and cascade throughout the business so that it leads to the most appropriate behavior at all levels.
With IEE strategic planning, focus is given to create targeted strategies aligned with the financials and customer wants, needs, and desires.
Step 6: IEE High Potential Areas and 30,000-foot-level Operational Goals
Organizations often have difficulty achieving high-level worded strategic plans or Lean Six Sigma process improvement projects. These efforts often fall off people’s plates in lieu of addressing their day-to-day activities.
With Lean Six Sigma, improvement projects are typically selected from a list of opportunities. Lean kaizen events and total quality management (TQM) improvement efforts typically also do not take a structured data-driven approach for project selection.
With the IEE enhanced business management system implementation, the entire enterprise is assessed to determine strategic projects that are to benefit the enterprise as a whole. This determination can be facilitated through the use of an Enterprise Improvement Plan (EIP).

As part of an IEE EIP, it is also most desirable when 30,000-foot-level metric goals can be set to value chain performance tracking where there is an owner of the process. The process owner understands that for them to meet their goal process enhancement is needed. These people that have ownership of processes will then be asking for the creation and timely completion of one or more projects that address their metric enhancement need. There will be a sense of urgency for those responsible for the change since they should be reporting the status of their 30,000-foot-level metric improvement progress to their ″boss’ boss″ monthly.
Step 7: IEE Improvement Projects
Improvement projects in Lean Six Sigma follow a Define-Measure-Analyze-Improve-Control (DMAIC) roadmap. The specific step-by-step detail for executing the DMAIC process is described in:
- Integrating Enterprise Excellence Volume III (over 1100 pages)
- Lean Six Sigma Project Execution Guide
Within IEE, improvement efforts do not require the execution of a Lean Six Sigma DMAIC roadmap. A just-to-it effort, kaizen event, or process automation may be what is required to improve the strategic 30,000-foot-level metric.
Step 8: IEE Assess Impact on Enterprise Goals
Traditionally the value of a Lean Six Sigma deployment effort is the amount of savings from the deployment. However, often these financial benefits are reported in isolation where there may be minimal big-picture benefits. Also, improvement efforts often do not give focus to enhancing the top line of the organization.
In IEE, focus is given strategically to improving processes that benefit the enterprise as a whole. This alignment is described in an EIP. A successful improvement project improves the procedures in an organizational value chain, which improves a 30,000-foot-level metric, which is aligned to a satellite-metric improvement desire.
Step 9: IEE Maintaining the Gain
Within the DMAIC roadmap, the last step is process control to maintain the gain from the project. However, often organizations do not have an infrastructure to address this objective and things returned back to where they were before the improvement effort.
In the IEE system, focus is given to the relationship of processes where Y, the process output, is a function of the process’ inputs and process steps; i.e., Y=f(x). It is best to timely control the X’s from an improvement project, which can be described in the value chain. However, the Y response of a value-chain 30,000-foot-level metric reporting format also provides an opportunity for creating a control mechanism for the process. Automatic updates should be used to timely address this gain maintenance.
One should note that step 9 loops back to step 3. This looping provides basically an Edwards Deming Plan-Do-Check-Act (PDCA) assessment for the enterprise as a whole.
Summary
In Louis Gerstner’s book Who Says Elephants Can’t Dance? , Gerstner describes how he was able to turn IBM around in the mid 1990’s. Jim Collins describes in his book How the Mighty Fall what Gerstner did as an exception for corporations; i.e., hire an outsider CEO to turn around a company. In any case, what Gerstner did to turn the IBM around did not stick. Why? In my opinion, what was initiated by Gerstner was not a long-lasting change to IBM’s business management system.
Traditional approaches to management goal setting and Key Performance Indicator (KPI) tracking can lead to unintended consequences that are unhealthy, if not destructive. I believe that this is what IBM did and was a source of the company losing its guiding direction.
IEE provides a system for management that helps them move toward achievement of the 3Rs of business; i.e., everyone doing the Right things, doing them Right, at the Right time.
IEE addresses the common-place business management scorecard and improvement efforts that are described in the one-minute video:

Contact Us to set up a time to discuss with Forrest Breyfogle how your organization might gain much from an Integrated Enterprise Excellence (IEE) business management system to improve bottom line.